PRESS
press (main input file)
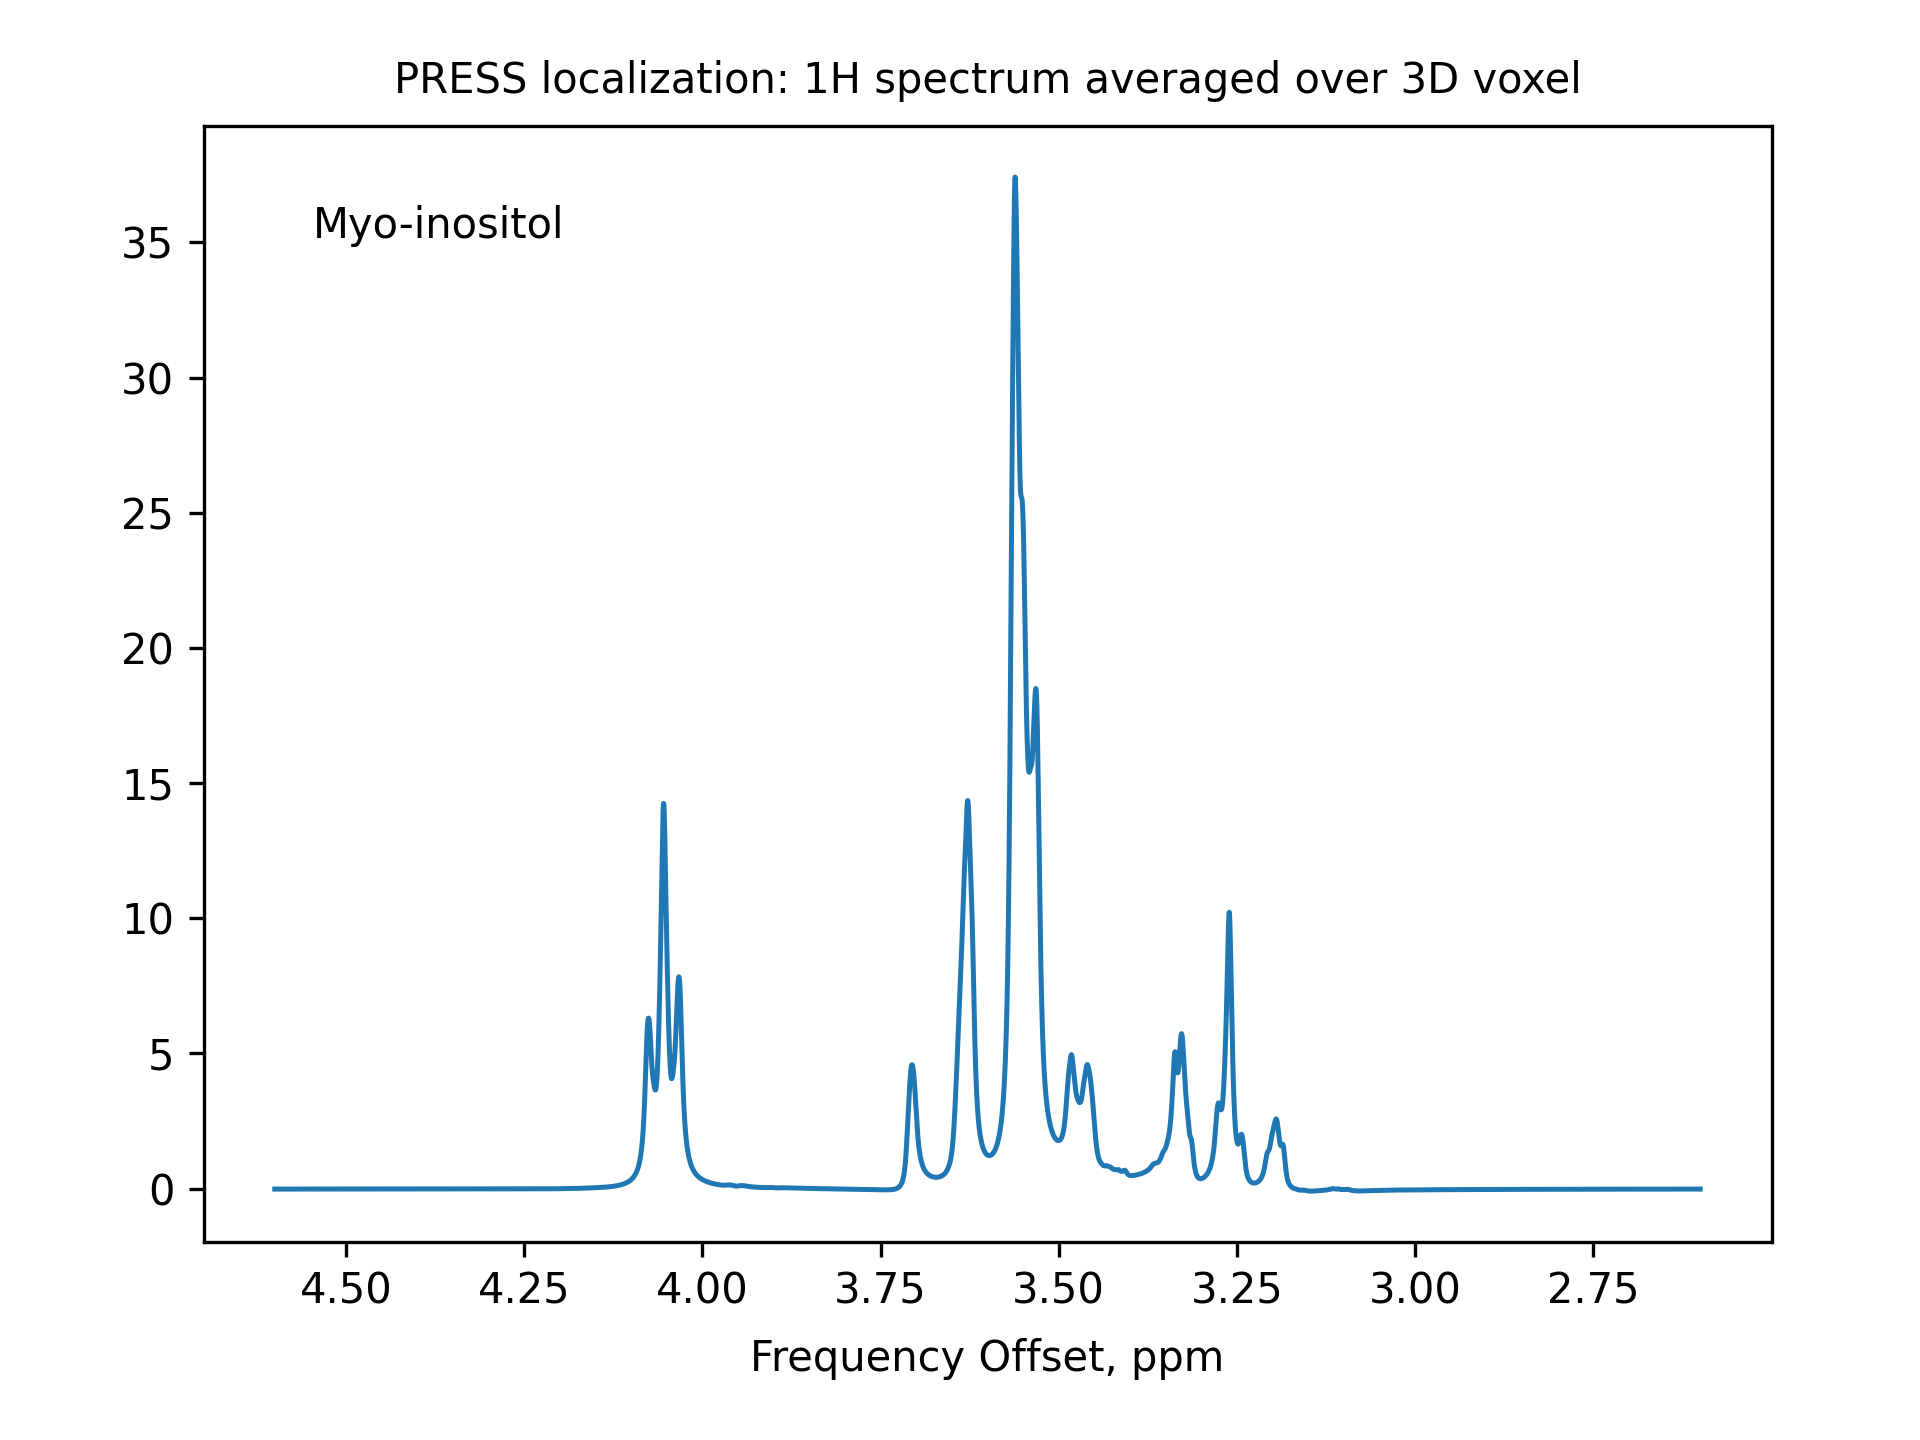
*******************************************************************************
** PRESS localization: 1H spectrum averaged over 3D voxel
** Reference:  Kaiser, L. G., Young, K., Matson, G. B. (2008)
** Numerical simulations of localized high field 1H MR spectroscopy.
** Journal of Magnetic Resonance, 195(1), 67–75.
****** The System *************************************************************
spectrometer(MHz)  125
spinning_freq(kHz) *
channels           H1
nuclei             *
atomic_coords      *
cs_isotropic       MOL.cs ppm
csa_parameters     *
j_coupling         MOL.j
quadrupole         *
dip_switchboard    *
csa_switchboard    *
exchange_nuclei    *
bond_len_nuclei    *
bond_ang_nuclei    *
tors_ang_nuclei    *
groups_nuclei      *
******* Pulse Sequence *******************************************************
CHN 1
timing(usec)    (t128.tm) 0 (0) (t200.tm) 0 (0 0) (t200.tm) 0 (4000)8k
power(kHz)      slr90.pwr 0  0   s180.pwr 0  0 0  s180.pwr  0   0
phase(deg)        90      0  0     0      0  0 0    0       0   0
freq_offs(kHz)     0      0  0     0      0  0 0    0       0   0
CHN G
timing(usec)    (t128.tm) 0 (0) (t200.tm) 0 (0 0) (t200.tm) 0 (4000)
grad_offs(kHz)     0      0  0     0      0  0 0    0       0   0
******* Variables ************************************************************

** slr90.pwr is the selective excitation pulse powers, kHz, for a 10 ms pulse
** s180.pwr  is the selective refocusing pulse powers, kHz, for a 10 ms pulse
** See examples/selective-pulses to investigate how these pulses work

** Specify selective pulses lengths, usec
T90 =  4000
T180 = 5000

** Specify (refocusing time)/(pulse length) ratio for the excitation pulse
** The refocusing time for the excitation pulse is given as a comment in slr90.pwr
r90 = 0.5050  // slr90

** Set up the selective excitation pulse
pulse_[1 2]_1=T90/128
psf_1_1=10000/T90

** Set up the selective refocusing pulses
pulse_[1 2]_4=T180/200
pulse_[1 2]_7=T180/200
psf_1_[4 7]=10000/T180

** Coherence pathway selected with the crusher gradinents
select_[2 5]=[-1 1]

** Localization: 3D average over the voxel volume **
** G1, G2, G3 are offsets, kHz, generated by PFGs along X, Y, and Z
ave_par1d G1/-2.5:0.1:2.5/
ave_par2d G2/-1:0.05:1/
ave_par3d G3/-1:0.05:1/
*G[1 2 3]=[0 0 0]  // for a single point inside the voxel
grad_offs_[1 4 7]=G[1 2 3]

** Refocus the linear phase generated by the selective excitation pulse
pulse_[1 2]_6_1=T90*r90
grad_offs_6_1=G1

** Additional interpulse delays (due to crusher gradients etc.)
t1=1000
t2=1000
pulse_[1 2]_3_1=t1
pulse_[1 2]_6_2=t1+t2
pulse_[1 2]_8_1=t2

fig_options="--text 0.07,0.90,Myo-inositol"
fig_title="PRESS localization: 1H spectrum averaged over 3D voxel"

******* Options ***************************************************************
rho0               F1z
observables        F1p
EulerAngles        *
n_gamma            *
line_broaden(Hz)   1
zerofill           *
FFT_dimensions     1 ppm
options       -re -macroMOL=myo-inositol -sysh6 -varppm_center_1=3.6 -py
*******************************************************************************
-- A different molecule can be easily chosen by using different values for the
command line options -macroMOL=... -sysh... -varppm_center_1=...
Files referenced from the main input file:
mio-inositol.cs
3.5217
4.0538
3.5217
3.6144
3.2690
3.6144
0.1
mio-inositol.j
1 2 2.889
1 6 9.998
2 3 3.006
3 4 9.997
4 5 9.485
5 6 9.482
slr90.pwr
 0.0000000e+00
-2.9240431e-05
-5.5617998e-05
-8.9752483e-05
-1.3153110e-04
...
-1.3153110e-04
-8.9752483e-05
-5.5617998e-05
-2.9240431e-05
 0.0000000e+00
s180.pwr
 0.0000000e+00
-1.6446000e-03
 5.1245000e-03
 2.8855000e-03
 2.5472000e-03
 ...
 2.5488000e-03
 2.8869000e-03
 5.1258000e-03
-1.6435000e-03
 0.0000000e+00
t128.tm
 78.125
 78.125
 78.125
 ...
 78.125
 78.125
 78.125
t200.tm
50
50
50
...
50
50
50
Notes
Files
The experiment is described in the press file. The molecule – in two additional files: myo-inositol.cs (chemical shifts) and myo-inositol.j (j-couplings). Selective pulses – in slr90.pwr (excitation pulse shape) and s180.pwr (refocusing pulse shape). Durations of each pulse in the shapes are also described in separate files: t128.tm and t200.tm.
Pulse Sequence section
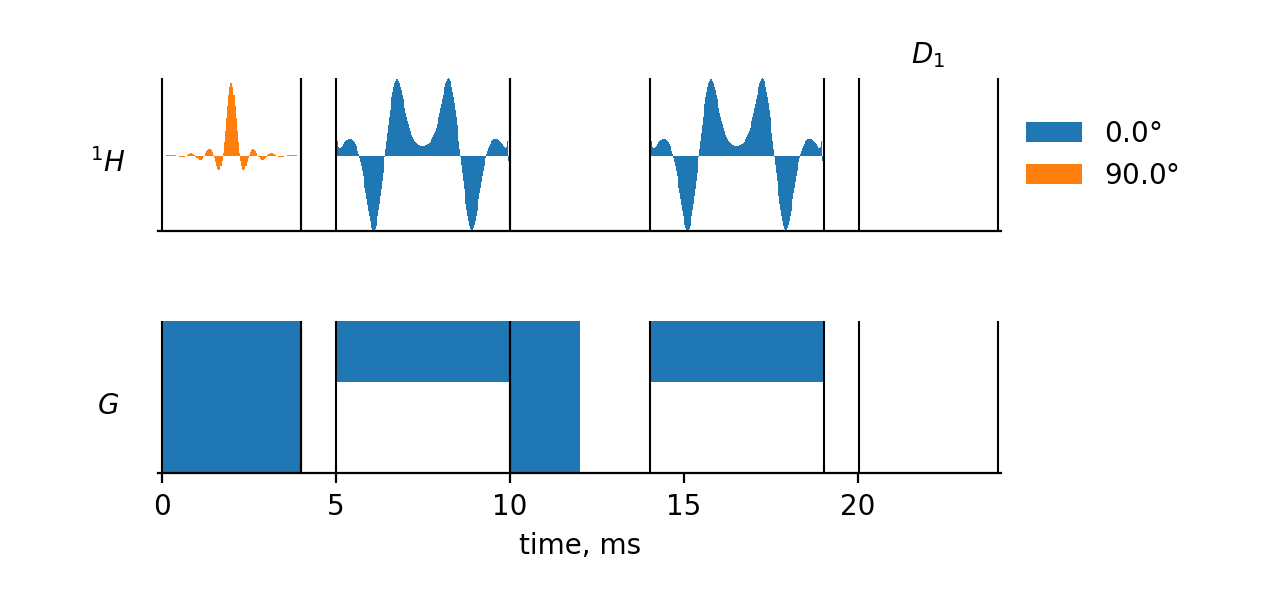
The pulse sequence in <>press is given as a series of 9 "elementary" pulse sequences, numbered 1 to 9. They are separated from each other by parentheses on the timing(usec) line. Sequences 1 to 9 belong to dimension zero, which means that each of them is repeated exactly the same number of times (in this case – once) for each observed data point. The sequence 9 (4000 usec delay) belongs to dimension 1, which means that its repeat number is incremented from 0 to 8191 in this dimension. The observations are performed at the very end of the whole pulse sequence, for each point in the dimension. Thus, we have a 1D experiment consisting of a preparation period followed by an FID detection.
All sequences, except for 1, 4, and 7, consist of just one pulse. The excitation shape consists of 128 pulses. The refocusing shapes consist of 200 pulses.
Most of the things in the "Pulse Sequence" section of the input file are self-explanatory.
All pulse durations, powers, phases, and frequencies set in this section can be overwritten in the Variables section that follows. Sometimes, it is convenient to put zeros for some values in the Pulse Sequence section, and then specify the actual values in the Variables section.
Variables section
All lines starting with an asterisk within this section are treated as comments.
pulse_[1 2]_1=T90/128
is a macro that is expanded into two different lines:
pulse_1_1=T90/128
pulse_2_1=T90/128
pulse_n_s is a vector of pulse lengths for sequence s on channel n (in this experiment, channel 2 is the gradients). Thus, each step in the excitation pulse (sequence 1) is set to T90/128 usec.
psf_n_s is the "power scaling factor" for sequence s on channel n. The default value for these factors is 1. Here, it is used to scale the powers of the shaped pulse in inverse proportion to the scaling of the pulse length from 10000 usec to T90.
Selective refocusing pulses are set up in a similar fashion.
The coherence pathway for PRESS is:
0 ->(excitation)-> -1 ->(refocus1)-> +1 ->(refocus2)-> -1 -> observe
The line
select_[2 5]=[-1 1]
Selects coherences of order -1 during sequence 2, and of order +1 during sequence 5, and kills all other coherences during these sequences. This is equivalent to independent crusher gradient pairs, each consisting of equal strength and duration gradients before and after the refocusing pulses.
The lines
ave_par1d G1/-2.5:0.1:2.5/
ave_par2d G2/-1:0.05:1/
ave_par3d G3/-1:0.05:1/
grad_offs_[1 4 7]=G[1 2 3]
where G1, G2, G3 are offsets, kHz, generated by PFGs along X, Y, and Z, produce a 3D average over the voxel volume.
The remaining lines in the section refocus the linear phase generated by the selective excitation pulse, add interpulse delays due to the crusher gradients, and add text to the output figure.
Options section
The lines
rho0               F1z
observables        F1p
line_broaden(Hz)   1
are self-explanatory.
The line
FFT_dimensions 1 ppm
specifies to Fourier-transform FID along dimension 1 and to use ppm as units for the output data labeling.
Usage
The simulation is run from the command line as
spinev press
The output (i.e. the spectrum in this case) is saved as press_re.dat and press_im.dat files and is also plotted in a separate window (as requested by the -py option).
A different molecule can be easily chosen by using different values for the command line options:
-macroMOL=... -sysh... -varppm_center_1=...